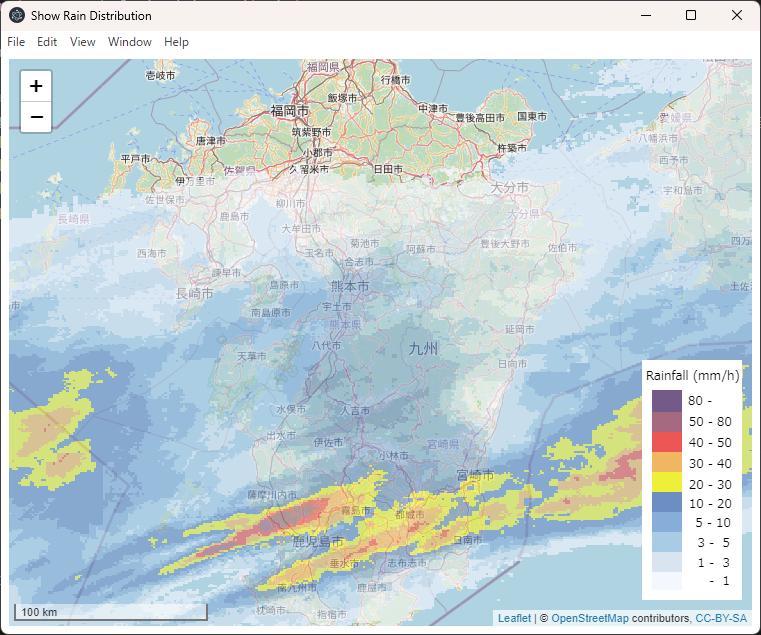
この記事ではこれまで解説したスキルを使ってGeoTIFFファイルの降雨データを表示する方法を解説していきたいと思います。サンプルコードを実行すると下図のような降雨分布が表示されます。
1. はじめに
ここまで、Leafletを使ってGeoTIFFファイルのデータを表示する方法について解説してきました。この記事ではこれまで解説したスキルを使ってGeoTIFFファイルの降雨データを表示する方法を解説していきたいと思います。
ここで解説する降雨分布の表示方法は、降雨データを降雨強度範囲ごとに色分け表示し、凡例を示すチャートも表示する実用的な内容となっています。
2. GeoTIFFファイルのデータを数値範囲ごとに色分け表示する方法
ここでは前回の記事で解説したとおりChroma.jsというライブラリを使って色分け表示と凡例表示をしていきます。
chroma.scale.domain.classesという関数を使って降雨強度範囲ごとに色を割り当てていきます。詳しい使い方は次のセクションの「ソースコードの解説」で説明していきます。
3. ソースコードの解説
この記事で取り上げたサンプルでもJavascriptライブラリーのLeafletを使っています。Leafletの基本的な導入方法については過去の記事で解説しています。
4行目から7行目までがLeafletを導入するためのリファレンスリンクです。
9行目はChroma.jsを導入するためのリファレンスリンクです。
25行目は、Leafletで設定した背景地図や今回のラスターデータを表示するためのdiv要素です。
29行目から32行目でLeafletで表示する地図の領域の範囲を設定しています。
35行目から38行目で背景地図のデータを指定しています。
ここまでは前回までの記事とほぼ同じです。
41行目で画面の左下に縮尺を表示しています。
44行目から52行目で凡例を設定しています。凡例の具体的な設定は46行目の関数create_legend()で定義しています。関数create_legend()の本体は88行目から137行目で定義されています。
89行目で凡例を描画するためのcanvas要素を宣言しています。104行目でChroma.jsを使って凡例の色を定義しています。ここでは10段階の色を定義しています。
108行目から111行目のforループで、凡例の各強度段階の矩形領域を定義した色で塗りつぶしています。
112行目から135行目までで、凡例の中の文字を表示しています。
55行目から86行目までで、GeoTIFFの降雨データの色調表示をしています。
61行目から62行目までで、各降雨強度範囲とそれに対応した色を定義しています。
64行目から81行目で各ピクセルに定義した色を割り付けています。
Leafletのサンプルコード「show_rain_distribution.html」
<html lang="ja">
  <head>
    <meta charset="utf-8" />
    <link rel="stylesheet" href="https://unpkg.com/leaflet@1.3.1/dist/leaflet.css" integrity="sha512Rksm5RenBEKSKFjgI3a41vrjkw4EVPlJ3+OiI65vTjIdo9brlAacEuKOiQ5OFh7cOI1bkDwLqdLw3Zg0cRJLQ==" crossorigin=""/>
    <script src="https://unpkg.com/leaflet@1.3.1/dist/leaflet.js" integrity="sha512-/Nsx9X4HebavoBvEBuyp3I7od5tA0UzAxs+j83KgC8PU0kgB4XiK4Lfe4y4cgBtaRJQEIFCW+oC506aPT2L1zw==" crossorigin=""></script>
    <script src="https://unpkg.com/georaster"></script>
    <script src="https://unpkg.com/georaster-layer-for-leaflet"></script>

    <script src="https://unpkg.com/chroma-js"></script>

    <style>
      #mapid {
        width:  100%;
        height: 100%;
      }
      #legend {
        text-align: center;
      }
      #legend_plane{
        border: 1px solid silver;
      }
    </style>
  </head>
  <body>
    <div id="mapid"></div>

        <script type="text/javascript">

            let map = L.map('mapid', {
                center: [37.0, 137.],
                zoom: 5.5,
            });


            let tileLayer = L.tileLayer('https://{s}.tile.openstreetmap.org/{z}/{x}/{y}.png', {
                attribution: '© <a href="http://osm.org/copyright">OpenStreetMap</a> contributors, <a href="http://creativecommons.org/licenses/by-sa/2.0/">CC-BY-SA</a>',
            });
            tileLayer.addTo(map);

            // 縮尺を表示
            L.control.scale({ maxWidth: 200, position: 'bottomleft', imperial: false }).addTo(map);

            // 地図上に凡例を表示
            L.Control.Legend = L.Control.extend({
                onAdd: function(map) {
                  return create_legend();
                }
            });
            L.control.Legend = function(opts) {
                return new L.Control.Legend(opts);
            }
            L.control.Legend({ position: 'bottomright' }).addTo(map);

            // GeoTIFFファイルを表示
            let geotiff_file = "./Z__C_RJTD_20190630202000_SRF_GPV_Ggis1km_Prr60lv_Aper10min_ANAL_grib2.tif";
            fetch(geotiff_file)
              .then(response => response.arrayBuffer())
              .then(arrayBuffer => {
                parseGeoraster(arrayBuffer).then(georaster => {

                  let scale = chroma.scale(["#f5f7ff", "#d6e5f0", "#a4cbe5", "#81aed6", "#668ec1", "#eeef4c", "#f7b768", "#f55857", "#aa6a81", "#765a88"])
                    .domain([0,200]).classes([0, 1, 3, 5, 10, 20, 30, 40, 50, 80, 200]);

                  let layer = new GeoRasterLayer({
                      georaster: georaster,
                      opacity: 0.6,
                      pixelValuesToColorFn: function(pixelValues) {
                        let pixelValue = pixelValues[0]; // there's just one band in this raster

                        // if there's zero wind, don't return a color
                        if (pixelValue === 0) return null;

                        // scale to 0 - 1 used by chroma
                        let color = scale(pixelValue).hex();

                        // console.log(color);
                        return color;

                      },
                      resolution: 256
                  });
                  // console.log("layer:", layer);
                  layer.addTo(map);
                  map.fitBounds(layer.getBounds());
                });
              });

              // 凡例を作る関数
              function create_legend() {
                let cs = L.DomUtil.create('canvas');
                  const legend_plane_width =  100;
                  const legend_plane_height = 240;
                  const div_num = 100;
                  const margin_left = 10;
                  const margin_top = 30;
                  const legend_width = 30;
                  const div_height = 2;
                  const tick_length = 5;
                  const margin_text_lengend = 30;
                  cs.width = legend_plane_width;
                  cs.height = legend_plane_height;
                  if (cs.getContext) {

                    let ctx = cs.getContext('2d');
                    let scl = chroma.scale(["#f5f7ff", "#d6e5f0", "#a4cbe5", "#81aed6", "#668ec1", "#eeef4c", "#f7b768", "#f55857", "#aa6a81", "#765a88"]).classes(10);
                    ctx.fillStyle = '#ffffff';
                    ctx.fillRect(0, 0, legend_plane_width, legend_plane_height);

                    for(let i = 0; i < div_num; i++){
                      ctx.fillStyle = scl((div_num - i)/div_num);
                      ctx.fillRect(margin_left, margin_top + i * div_height, legend_width, div_height);
                    }
                    ctx.strokeStyle = "black";
                    ctx.lineWidth = 1;

                    ctx.textBaseline = 'center';
                    ctx.textAlign = 'left';

                    ctx.font = '12px sans-serif';
                    ctx.fillStyle = 'black';
                    ctx.fillText("Rainfall (mm/h)", 4, 20);
                    const left_pos_top = 46;
                    const top_pos = 45;
                    ctx.fillText("80 -", left_pos_top, top_pos);
                    ctx.textAlign = 'right';
                    const left_pos_2nd = 90;
                    ctx.fillText("50 - 80", left_pos_2nd, top_pos + 21);
                    ctx.fillText("40 - 50", left_pos_2nd, top_pos + 42);
                    ctx.fillText("30 - 40", left_pos_2nd, top_pos + 63);
                    ctx.fillText("20 - 30", left_pos_2nd, top_pos + 84);
                    ctx.fillText("10 - 20", left_pos_2nd, top_pos + 103);
                    ctx.fillText(" 5 - 10", left_pos_2nd-1, top_pos + 122);
                    ctx.fillText(" 3 -  5", left_pos_2nd-2, top_pos + 142);
                    ctx.fillText(" 1 -  3", left_pos_2nd-2, top_pos + 162);
                    ctx.fillText("    -  1", left_pos_2nd-2, top_pos + 180);
                  }
                  return cs;
              }
        </script>
    </body>
</html>
4. ソースコードの動かし方
この記事で使うソースコードは、下記のリンクからダウンロードすることができます。ただ、その中にあるhtmlのソースコード「show_rain_distribution.html」をブラウザから開いても背景の日本地図と凡例、縮尺は表示されますが、降雨データの分布は表示されません。
GeoTIFFファイルを表示しようと思ったら、show_rain_distribution.htmlとGeoTIFFファイルの両方をウェブサーバー上の同一ディレクトリに配置する必要があります。
ウェブサーバーを用意するのはなかなか大変だと思いますので、ここで配布するサンプルプログラムではnode.jsというサーバサイドJavascriptのプラットフォームを用いています。よって、このサンプルプログラムを動かす前に、node.jsをインストールする必要があります。
ダウンロードしたzipファイルを解凍すると、package.jsonを始めとする4つのファイルが格納されたフォルダが現れます。そのフォルダ上でコマンドプロンプトまたはターミナル画面を開き、下記のコマンドを打ち込みます。
npm install
npm start
1行目のコマンドを打ち込むと、node.jsの必要なモジュールがインストールされます。これには数分かかると思います。そして、2行目のコマンドを打ち込むと、下図のようにウィンドウに日本地図 を背景としてGeoTIFFファイルに保存された降雨分布が表示されたウィンドウが現れます。
5. まとめ
この記事では、Javascriptのライブラリ「Leaflet」でGeoTIFFファイルの降雨データを表示する方法を解説しました。
Javascriptのライブラリ「Chroma.js」を使えばかなり詳細に色調をカスタマイズすることができ、それによって十分に実用的な降雨分布や降雨強度の凡例を表示することができました。
次の記事では、この降雨分布の時系列データを使ってアニメーション表示する方法を解説していきたいと思います。
以上、最後まで読んでいただきありがとうございました。